Google releases amazing features and optimization updates to increase the user’s experience on a webpage. One of the most important optimization updates Google considers now is visual load speed, visual stability, and interactivity/responsiveness.
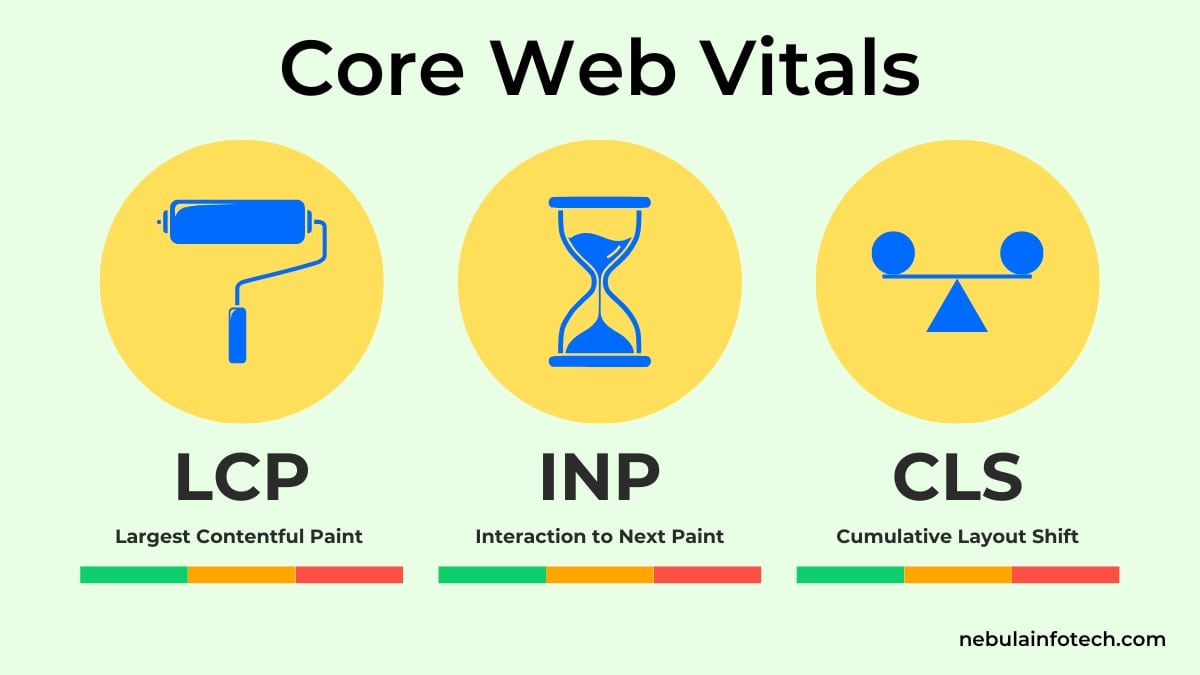
There are technical names for these things: Largest Contentful Paint (LCP), Cumulative Layout Shift (CLS), and Interaction to Next Paint (INP). Google uses the data that comes out of the User Experience Report (CrUX), this report contains how your website performed while loading the webpage on their browser.
The web core vitals also include a mobile-specific report, which looks at the webpage’s performance on mobile devices.
Since May 2021, Core Web Vitals metrics have been used for ranking websites, first starting on mobile screens, followed by desktop. If SEO matters to you, optimizing Core Web Vitals should be a priority.
I am sharing here a comprehensive guide for understanding Web Core Vitals, how to improve Web Core Vitals, and other ins and outs of the content.
What Are Core Web Vitals?
The Web Core Vitals are a group of three metrics that measure the speed, interactivity, and visual stability of your website’s pages. Google has multiple ranking signals, and one of them is “Page Experience”. Web Core Vital has a direct impact on the Page Experience ranking signal. Improving these metrics will help you in ranking your website in search results.
Google showcases the Web Core Vital in a report. The following are the three metrics that the Web Core Vital report showcases-
- Largest Contentful Paint (LCP)
- Interaction to Next Paint (INP)
- Cumulative Layout Shift (CLS)
Before getting to know what, these metrics are, you need a general understanding of the report and how to read the report.
Understanding Web Core Vital Report
The Web Core Vitals report is a report that shows how your page is performing based on real-world usage data.
The reports show how URL performance is based on the status (Poor, Need improvement, Good), metric type (CLS, INP, and LCP), and URL group (groups of similar web pages).
The report is based on three metrics: LCP, INP, and CLS. There are some rules that you have to know while reading the report-
- The report is prepared with a minimum amount of reporting data for both LCP and CLS.
- URLs that do not have data will be omitted from the report.
- Only an indexed URL can appear on the report.
- The data is combined for all requests from all locations. If you have traffic from a location that has slow internet, then your performance will automatically go down in the report.
Benchmark of LCP, INP & CLS
The following are the benchmarks for each category-
| Good | Needs improvement | Poor | |
| LCP | <=2.5s | >2.5s – <=4s | >4s |
| INP | <=200ms | >200ms – <=500ms | >500ms |
| CLS | <=0.1 | >0.1 – <=0.25 | >0.25 |
Now that you know the basics on which you have read the report. It becomes easier for you to go further and learn more about what LCP, INP, and CLS are.
Largest Contentful Paint (LCP)
Largest Contentful Paint (LCP) is a metric that measures the time it takes to load the single largest visible element in the viewport (Technical term for visible screen).
To understand LCP, you have to understand how a website loads. A website has two main components- Frontend and Backend.
The frontend of a webpage consists of HTML, CSS, and JavaScript. A web browser has a rendering engine that loads the webpage by parsing the HTML to generate the Document Object Model (DOM).
The browser then processes the DOM and applies styles from CSS files, followed by executing the JavaScript to display the visual output.
Within this entire lifecycle of the webpage loading, there are many factors that influence the LCP, such as server response time, render-blocking resources, code quality, and image optimization.
Now, you might have a question: what DOM elements will be the Largest Contentful Paint?
It depends on website to website, but largely the following are interpreted as Largest Contentful Paint-
- <img> element
- <image> element inside an <svg> element
- Image inside a <video> element
- Background image loaded with the URL() function
- Blocks of text
Interaction to Next Paint (INP)
Interaction to Next Paint (INP) is a metric that measures how quickly a website responds to a user’s interaction. It uses Event Timing API to observe the latency of all clicks, taps, and keyboard interactions with a page throughout its lifespan.
A good INP rating should be less than or equal to 200 milliseconds. INP between 200 and 500 milliseconds is considered average, and below 500 milliseconds is poor.
There can be many factors that influence the INP ratings, such as server speed, size of the website, Inefficient event handlers, etc., but mostly, if you keep buying a fast server and keep your website light, then your INP rating will be good.
Cumulative Layout Shift (CLS)
Cumulative Layout Shift (CLS) measures the visual stability of a page when it loads. It looks at how big an element is and how far it moves after being fully loaded.
Google measures the event when you load the page and within five seconds how many shift occurs. It must have occurred to you many times when you open up a webpage and you see a button, but when you try to click it, you accidentally click on something else, like ads, because the button gets shifted.
This layout shift of elements negatively impacts the website user experience. Some of the common causes of CLS are as follows-
- Images without dimensions
- Ads, embeds, and iframes without dimensions
- Injecting content with JavaScript
- Applying fonts or styles late in the load
Why Are Core Web Vitals Important?
Core Web Vitals (CWVs) are essential for improving your website’s SEO performance, user experience, and overall website effectiveness. Here’s how Core Web Vitals plays an Important role-
- Google uses CWVs as a ranking factor, and a higher CWV score can improve your chances of ranking higher in Google Search.
- Google released the CWV update to ensure that the overall user experience and engagement of the website are better.
- It reduces the bounce rate and increases conversion due to increase the user experience.
- With mobile-first indexing, Google prioritizes the mobile page performance in ranking, and CWVs help you in achieving that.
Tools to Measure Web Core Vitals
Now that you understand what Core Web Vitals are, you have to learn how to measure them. There are several tools that you can use to measure CWVs-
Google PageSpeed Insights
- Visit the official Google PageSpeed Insights page
- After visiting the website, copy the URL you want to find the CWV score for and paste the URL in the given field
- After that, you’ll have to click on the analyze button
- After clicking on the analyze button, the score for CWV will be displayed on the screen
- You can click on the mobile and desktop icons to switch between the two to find the score of both devices
- The report will tell you in detail about all three web vitals and how to improve them.
Google Search Console (Core Web Vitals Report)
- Visit Google Search Console and make sure that you’ve selected the property (i.e., website) that you want to find the score for
- On the left-hand side of the menu, you’ll find the Core Web Vitals under the Experience field
- You can choose between Mobile and Desktop reports, and the report is categorized based on URLs
Lighthouse (Chrome DevTools)
- Lighthouse is a Chrome DevTools and can be accessed using Chrome itself
- Visit your website whose CWVs score you want to analyze
- After that, click F12 on the keyword or Right click, followed by clicking on DevTools
- After that, you’ll have to click on the lighthouse tab, and you’ll find the report
- You can choose device type- or Desktop
- Select the Performance category and click Analyze page load, and after the report is generated, you can find detailed information on LCP, INP, and CLS scores
Chrome User Experience Report (CrUX)
You can access the Chrome User Experience Report by visiting the CruX Dashboard on Google Data Studio.
Click on the Get Started button and enter your website Domain, followed by selecting the Core Web Vitals from the available reports.
You can find the historical performance of all the Web Core vitals, and you can also analyze data across different devices, locations, and network conditions.
How to Fix Web Core Vital Issues?
After diagnosis, now comes the fixing or correcting part. You have to fix the Web Core Vital issue to ensure your score is high. The following are the steps that you can take to fix the Web Core Vitals-
Largest Contentful Paint (LCP)
Since LCP measures how quickly the largest visible element loads on a page. Reducing the size of these elements will improve the LCP Score. Some of the common causes of poor LCP are as follows-
- Slow server response time
- Render-blocking resources (CSS & JavaScript)
- Unoptimized images or videos
- Slow client-side rendering
Solutions & Fixes
- Use a Fast hosting provider, preferably, cloud server, to ensure your website is fast and better performing
- Optimize your website’s backend code and database queries
- Use a Content Delivery Network (CDN) to reduce latency for global users
- Minify and defer CSS and JavaScript files
- Load critical CSS inline to render the page faster.
- Use the async or defer attribute for JavaScript files.
- Use modern formats like WebP, AVIF instead of PNG or JPEG
- Implement lazy loading for below-the-fold images
- Resize images based on the screen size
- Use CDN-based image optimization tools like Cloudflare, Imgix, or Optimole
- Enable browser caching for static assets.
- Implement server-side caching
Interaction to Next Paint (INP)
INP measures the time it takes for the webpage to respond to the user interactions. If you can improve the elements’ loading speed, you can influence the INP rating. Some of the common causes of poor INP are as follows-
- Heavy JavaScript-based website that demands more execution time
- Unoptimized even listeners like clicks, scrolls, popups, etc.
- Too many third-party scripts
- Long-running tasks blocking the main thread
Solutions & Fixes
- Try to minify JavaScript and remove unused JavaScript code
- Use async & defer attributes for non-critical scripts
- Use Web Workers to offload non-UI tasks.
- Avoid excessive DOM reflows and repaints by batching updates
- Remove unnecessary ads, trackers, and analytics scripts
- Use defers or lazy loading for widgets
- Minify CSS and remove unused CSS
Cumulative Layout Shift (CLS)
CLS measures how much your website’s content shifts unexpectedly during the loading. If you can prioritize the website elements using coding, then you can improve the CLS scores. Some of the common causes of poor CLS scores are as follows-
- Large loading ads, popups, and embedded codes
- Missing width and height attributes for images
- Dynamically injected content pushing down visible elements
- Fonts are loading late, causing text shifts
Solutions & Fixes
- Always define dimensions for all images, iframes, and videos
- Allocate a fixed height for ad containers, YouTube Embeds
- Use font-display: swap to prevent invisible text (FOIT issue)
- Preload key fonts in the <head> of the document
- Add placeholders for elements that load asynchronously
I am Sunil Tarwara, a seasoned IT professional with over 13 years of hands-on experience in Website Development and Digital Marketing. With a deep understanding of the challenges faced by businesses, I have been trusted by hundreds of clients to achieve their digital goals. I have Master’s degree in Information Technology.
Apart from websites, I like hill stations.


